Tools for working with cancer registry data.
Installation
You can install the development version of OncReg from GitHub with:
remotes::install_github("hongconsulting/OncReg")Example: comma-separated free text, Microsoft Excel dates, and survival analysis
library(OncReg)
options(width = 120)
diagnosis <- c("01/01/00", "01/01/2000", "36526", "36526", "36526")
treatment <- c("capecitabine",
"LETROZOLE",
"letrozole, palbociclib",
"Letrozole,Ribociclib",
"anastrozole, ribociclib")
progression <- c("01/01/2001", ".", "01/01/2001", "", NA)
review1 <- c("01/07/2001", "01/07/2001", "01/07/2001", "01/07/2001", "01/07/2001")
review2 <- c(NA, NA, NA, NA, "01/01/2002")
death <- c("01/01/2002", "01/01/2002", NA, NA, NA)
data0 <- data.frame("id" = 1:5, "diagnosis" = diagnosis, "treatment" = treatment, "progression" = progression, "review1" = review1, "review2" = review2, "death" = death)
print(data0)
#> id diagnosis treatment progression review1 review2 death
#> 1 1 01/01/00 capecitabine 01/01/2001 01/07/2001 <NA> 01/01/2002
#> 2 2 01/01/2000 LETROZOLE . 01/07/2001 <NA> 01/01/2002
#> 3 3 36526 letrozole, palbociclib 01/01/2001 01/07/2001 <NA> <NA>
#> 4 4 36526 Letrozole,Ribociclib 01/07/2001 <NA> <NA>
#> 5 5 36526 anastrozole, ribociclib <NA> 01/07/2001 01/01/2002 <NA>
# delimited strings
data1 <- data.frame("id" = data0$id, "treatment" = data0$treatment)
data1$treatment <- OR.delim.replace(data1$treatment, "anastrozole", "ai")
data1$treatment <- OR.delim.replace(data1$treatment, "letrozole", "ai")
data1$treatment <- OR.delim.replace(data1$treatment, "palbociclib", "cdk46i")
data1$treatment <- OR.delim.replace(data1$treatment, "ribociclib", "cdk46i")
# Microsoft Excel dates
data1$diagnosis <- OR.dmyY.to.Excel(data0$diagnosis, 20, 25)
data1$progression <- OR.dmyY.to.Excel(data0$progression, 20, 25)
data1$review1 <- OR.dmyY.to.Excel(data0$review1, 20, 25)
data1$review2 <- OR.dmyY.to.Excel(data0$review2, 20, 25)
data1$death <- OR.dmyY.to.Excel(data0$death, 20, 25)
# progression-free survival and overall survival:
# - PFS date is the date of progression or death, whichever is earlier
data1$PFS <- OR.rowmin(cbind(data1$progression, data1$death))
# - last review date is the latest date patient was observed alive
data1$lastreview <- OR.rowmax(cbind(data1$review1, data1$review2))
data1$PFSmonths <- OR.survoutcome(data1$diagnosis, data1$PFS, data1$lastreview)[, 1]
data1$PFSstatus <- OR.survoutcome(data1$diagnosis, data1$PFS, data1$lastreview)[, 2]
data1$OSmonths <- OR.survoutcome(data1$diagnosis, data1$death, data1$lastreview)[, 1]
data1$OSstatus <- OR.survoutcome(data1$diagnosis, data1$death, data1$lastreview)[, 2]
print(data1)
#> id treatment diagnosis progression review1 review2 death PFS lastreview PFSmonths PFSstatus OSmonths OSstatus
#> 1 1 capecitabine 36526 36892 37073 NA 37257 36892 37073 12.02489 1 24.01692 1
#> 2 2 ai 36526 NA 37073 NA 37257 37257 37073 24.01692 1 24.01692 1
#> 3 3 ai, cdk46i 36526 36892 37073 NA NA 36892 37073 12.02489 1 17.97162 0
#> 4 4 ai, cdk46i 36526 NA 37073 NA NA NA 37073 17.97162 0 17.97162 0
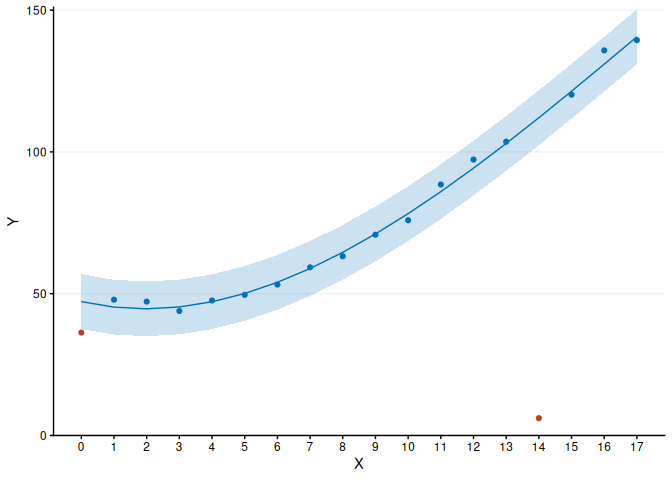
#> 5 5 ai, cdk46i 36526 NA 37073 37257 NA NA 37257 24.01692 0 24.01692 0Example: outlier detection
y <- c(36.3, 47.9, 47.2, 43.9, 47.6, 49.6, 53.2, 59.3, 63.2, 70.8, 75.9, 88.5,
       97.3, 103.6, 6.1, 120.2, 135.8, 139.4)
x <- 1:length(y) - 1
fig1 <- OR.outliers.rlm.ggplot(x, y, max.degree = 4, p = 0.0027, x.title = "X",
                               y.breaks = seq(0, 150, 50), y.title = "Y")
print(fig1)