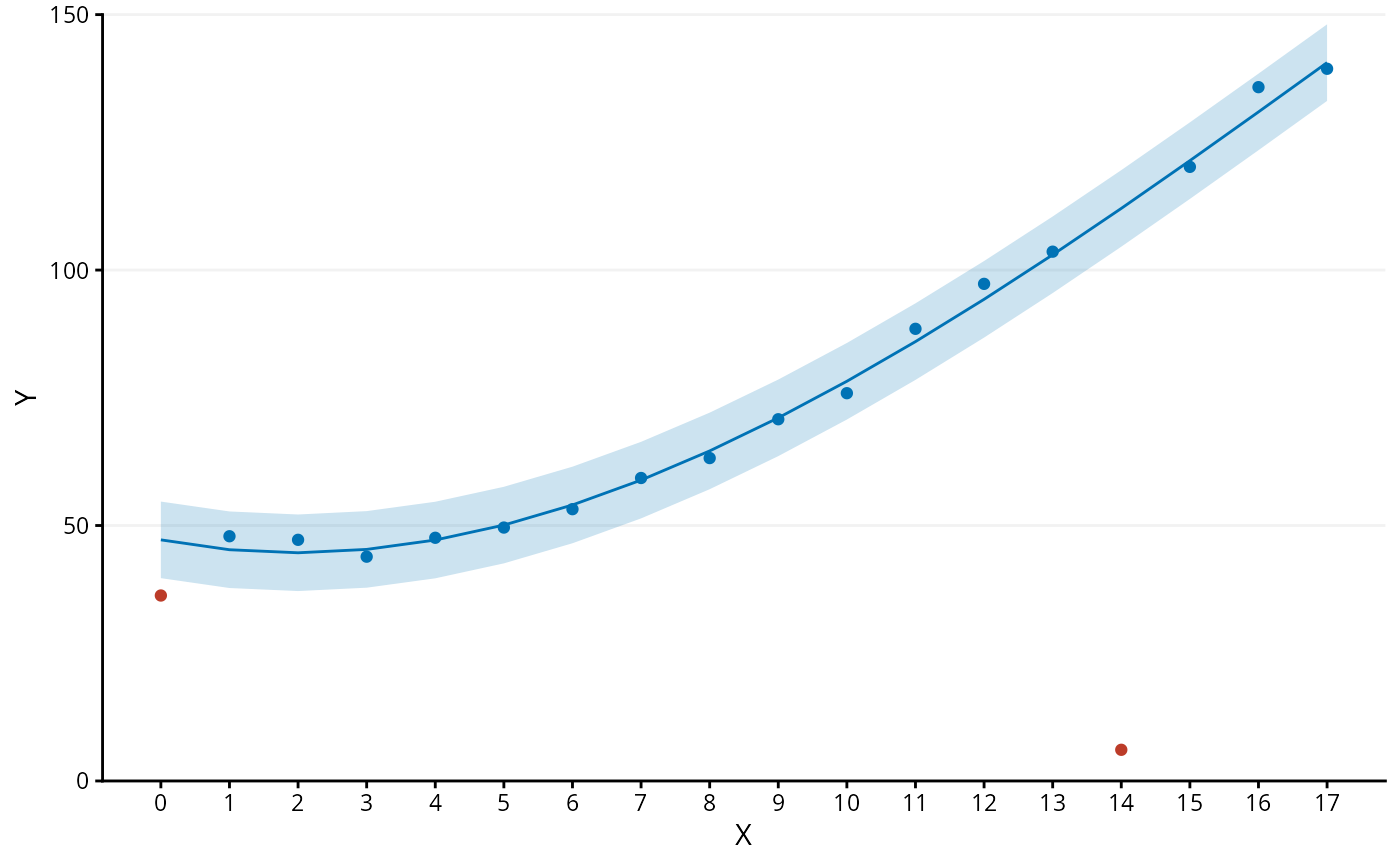
Fits a univariable polynomial regression using Huber M-estimation with degree selected by robust AIC (AICR), then flags observations whose residuals exceed a small-sample–adjusted multiple (k) of the median absolute deviation (MAD).
Usage
OR.outliers.rlm.ggplot(
  x,
  y,
  max.degree = 3,
  p = 0.05,
  tol.min = 1e-04,
  tol.target = 1e-04,
  col.in = "#0072B5FF",
  col.out = "#BC3C29FF",
  echo = FALSE,
  x.breaks = NA,
  x.labels = NA,
  x.title = "",
  y.breaks = NA,
  y.title = ""
)
Arguments
- x
Numeric predictor vector.
- y
Numeric response vector.
- max.degree
Maximum polynomial degree considered. Default =
3. Internally capped atn - 2, wherenis the number of non-missing observations.- p
Target two-sided exclusion proportion under normality for the residual-based modified z-score rule. Default =
0.05.- tol.min
M-estimation minimum convergence tolerance. Default =
0.0001.- tol.target
M-estimation target convergence tolerance. Default =
0.0001.- col.in
Color used for the fitted curve, ribbon band, and observations not flagged as outliers. Default =
"#0072B5FF".- col.out
Color used for observations flagged as outliers. Default =
"#BC3C29FF".- echo
Logical. If
TRUE, prints the internal data frame used for the plot together with the computed k and MAD values.- x.breaks
Numeric vector specifying x-axis tick locations. If
NA, the values ofxare used.- x.labels
Labels for the x-axis ticks. If
NA, the values ofxare used.- x.title
Title for the x-axis.
- y.breaks
Numeric vector specifying y-axis tick locations. Horizontal gridlines are drawn at these values.
- y.title
Title for the y-axis.
Details
For numerical stability, x and y are standardized before fitting and
back-transformed for plotting.
See also
Other outliers:
OR.kMAD(),
OR.outliers(),
OR.outliers.rlm()